Texas · GA Daily Post
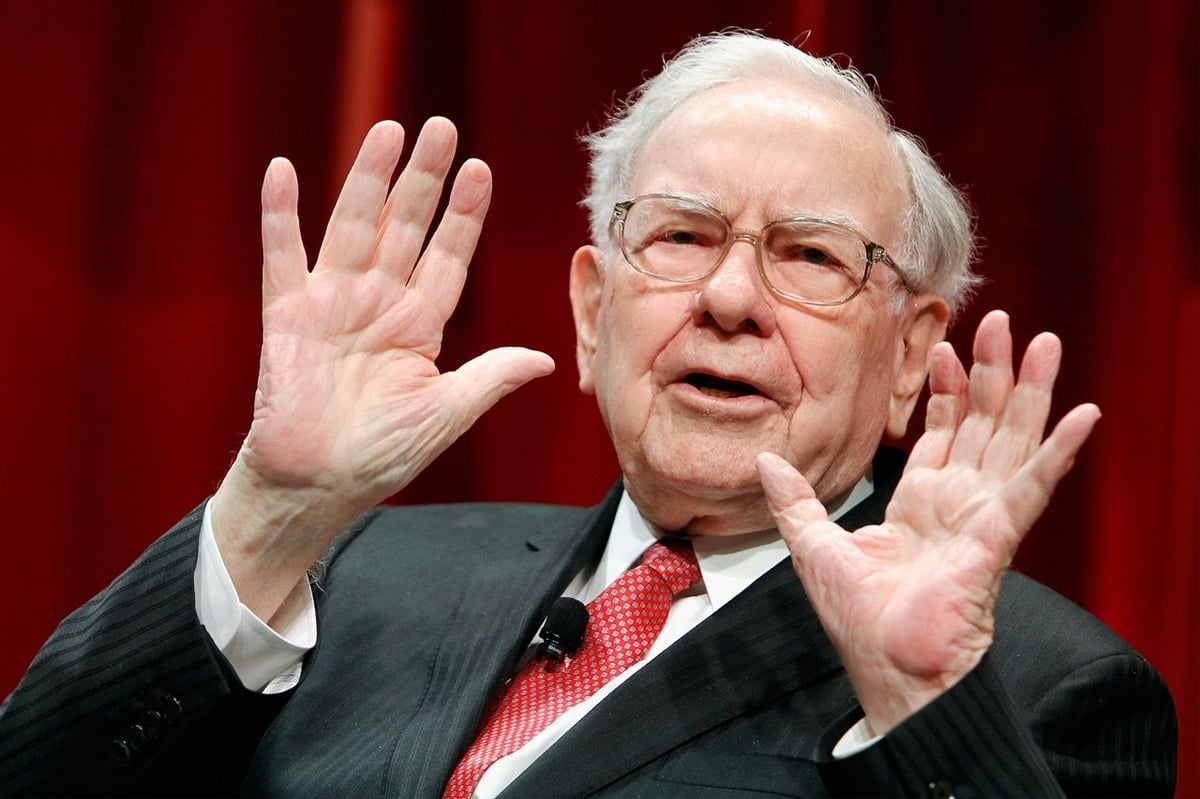
This has been a year of immense change for Berkshire Hathaway ( BRKA -0.01% ) ( BRKB -0.25% ) and its shareholders. At the end of last year, longtime CEO Warren Buffett , who outperformed the benchmark S&P 500 ( ^GSPC +0.31% ) by more than 6,000,000%, retired. This paved the way for his understudy, Greg Abel, to take over the company's day-to-day operations and the oversight of its $359 billion investment portfolio.
Although the trillion-dollar conglomerate that the Oracle of Omaha built has a new leader, the message, both good and bad, stays the same. While Berkshire's portfolio remains highly concentrated and focused on the long term , Warren Buffett and Greg Abel just sent shockwaves through Wall Street with a $377 billion warning. Warren Buffett and his successor, Greg Abel, have been net sellers of stocks in 15 of the last 16 quarters.
Image source: Getty Images. Buffett and Abel have been sending not-so-subtle warnings to Wall Street and investors Earlier today, Nov. 7, Berkshire Hathaway released its third-quarter operating results, which featured a $12.7 billion operating profit and a significant uptick in share repurchases. But contained within Berkshire's operating results was a figure that Wall Street and investors can no longer ignore .
The company's cash pile, comprised of cash, cash equivalents, and U.S. Treasury bills, ballooned to $377.4 billion. Berkshire Hathaway is now sitting on a staggering $365 Billion in cash, enough to buy 472 companies in the S&P 500 🚨 🤑 https://t.co/D3tR2PV45p — Barchart (@Barchart) November 6, 2026 Usually, a well-funded balance sheet would be viewed favorably by the investing community.
But given that Buffett built Berkshire Hathaway into the trillion-dollar company it is today through acquisitions and investments, $377.4 billion sitting in cash and earning interest isn't a welcome sign. Wall Street has become accustomed to seeing Berkshire's bosses put this capital to work. Furthermore, Berkshire's third-quarter consolidated cash flow statement shows that $426 million more in equity securities were sold than purchased.
For the 15th time over the last 16 quarters (four years), Buffett or Abel were net sellers. Image source: Getty Images. Finding value in a historically expensive stock market has been challenging While Warren Buffett bent or broke several of his unwritten investing rules over multiple decades, the one rule he and his successor, Greg Abel, refuse to break concerns value.
Both are absolute sticklers for getting a good deal, and today's stock market makes finding a bargain incredibly challenging . In a rare 2001 interview with Fortune magazine, Buffett lifted the lid on his favorite valuation tool , the market-cap-to-GDP ratio, now known affably as the Buffett indicator. He referred to this indicator as "probably the best single measure of where valuations stand at any given moment." When backtested to December 1970, the Buffett indicator has averaged approximately 89%.
This is to say that the total value of U.S. stocks has averaged 89% of U.S. gross domestic product (GDP) . In August, the Buffett indicator reached an all-time high of 236.42% and remains well above its historic average. Stock Market reaches most expensive valuation in history after the Warren Buffett Indicator hits 239%, surpassing the Dot Com Bubble, the Global Financial Crisis, and the 2022 Bear Market 🤯 👀 https://t.co/K5LBAN6S2Q — Barchart (@Barchart) August 15, 2026 It's no coincidence that the Oracle of Omaha was a net seller of stocks for 13 consecutive quarters leading up to his retirement, or that Abel has been a net seller in two of three quarters since taking the reins.
History shows that premium valuations aren't sustainable over the long run. While it's impossible to accurately predict when stock market downturns will begin, history has a way of rhyming on Wall Street, at least with regard to outsize valuations. Suffice it to say, Buffett's and Abel's warning to Wall Street is reaching deafening levels.
Source: The Motley Fool